
ZUM-Unterrichten
ZUM-Unterrichten ist eine offene, nicht-kommerzielle Plattform für Unterrichtsmaterialien und Unterrichtsideen.

Lehrer-Online ist das reichweitenstärkste redaktionell betreute Material- und Serviceportal für Lehrkräfte aller Schulformen, -stufen und -fächer im deutschsprachigen Raum. Das Redesign auf Lehrer-Online bringt frischen Wind auf das Portal und verbessert […]

Digitale Grundkenntnisse und Basisfähigkeiten im Programmieren vermitteln zu können, ist eine der Herausforderungen, vor denen Schulen heutzutage stehen. Um Schülerinnen auf ein Leben in einer stetig digitaler werdenden Gesellschaft und […]

Hallo liebe ZUM.de-Community! Heute hatte ich das Vergnügen, an einem inspirierenden pädagogischen Tag teilzunehmen, bei dem Förderlehrkräfte ihre besten Tipps und Tricks austauschten, wie sie Schülerinnen und Schüler unterstützen können, deren […]

Vom 6.-8.März fand das OERCamp in Hamburg statt. Bereits im Teil 1 haben wir über unsere Eindrücke geschrieben. Patricks Fazit war so lang, dass wir es als eigenen Blogpost veröffentlichen. […]
In diesem Lernpfad bekommst Du einen Einblick in verschiedene Berufe und erkundest, bei welchen Aufgaben in diesen Berufen Mathematik wichtig wird. Der Lernpfad besteht aus vier Kapiteln, die jeweils einen […]

In diesem Lernpfad (oder auch Stationenlernen) kannst Du vieles über das Alte Ägypten lernen. Durch die günstige Lage am Nil entwickelte sich eine Hochkultur mit Schrift, einheitlicher Religion und den […]

Du hast bereits gelernt, was Funktionen sind und dabei besonders die Linearen Funktionen unter die Lupe genommen. In diesem Lernpfad geht es darum, Eigenschaften einer weiteren Art von Funktionen zu […]
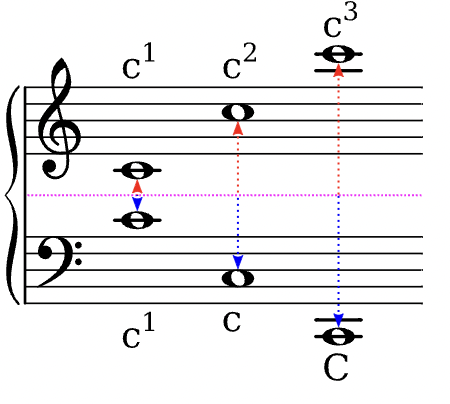
Auf dieser Seite entsteht eine Sammlung von musikalischen Fachbegriffen, wie sie im Kernlehrplan des Landes NRW gebraucht werden. Die Eintragungen erfolgen sukzessiv …